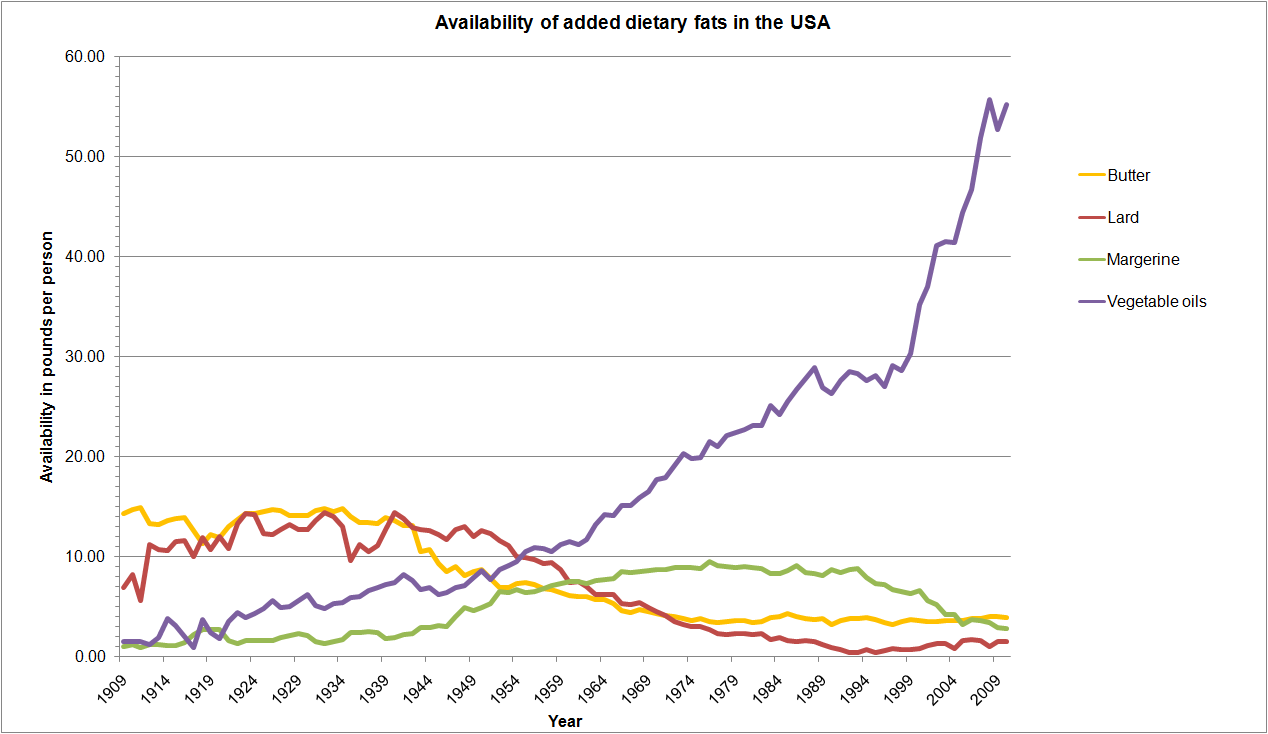
In a manner of speaking, the chart above demonstrates the success of public health education. Since the 1960s, public health officials have advised people to lower their consumption of animal fat and increase their consumption of unsaturated fats from vegetable oils1.
The graph, which charts the availability of various sources of added dietary fat from 1909 to 2010, shows a precipitous decline for lard and butter from the early 1950s onwards. (Availability isn’t the same thing as consumption, but for long-trend historical data, it’s the closest statistic we have.) Margarine, lauded for decades as heart-healthy, rises steady in popularity in the post-war years before beginning to tail off in the 1990s with the growing realization that trans fats, created by the partial hydrogenation of vegetable oils, render margarine a serious menace to coronary health234.
But by far the most arresting progress is that of salad and cooking oils derived from vegetables. In 1909 they register as barely a blip, but over the course of a century they maintain a rising trajectory that grows to meteoric over the last ten years.
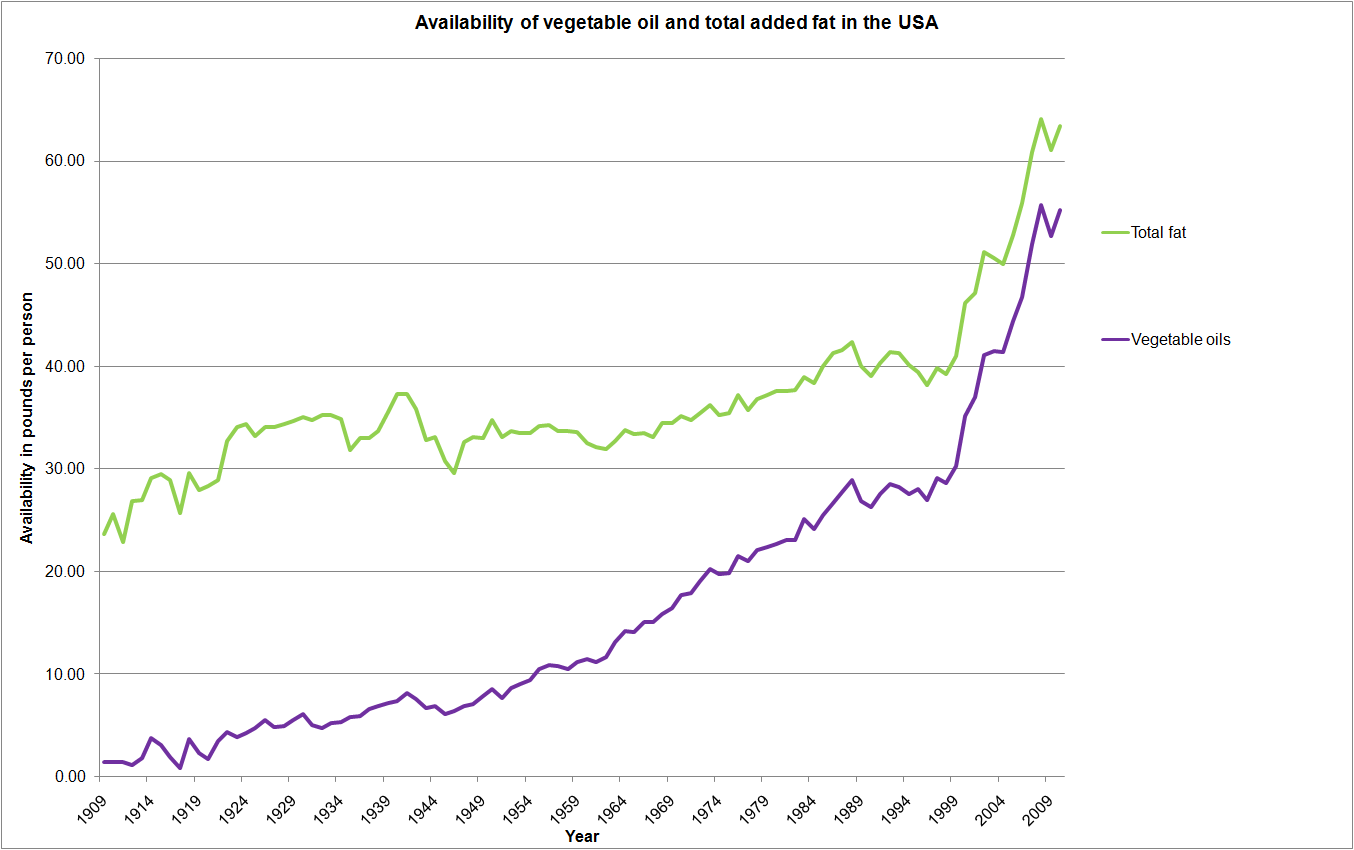
If you add all the components of the previous graph together, you can see that total fat availability didn’t grow a huge amount from the 1920s right the way up to the late 1990s; fat availability was 34.4lb per person in 1924, 33.5lb in 1954, 35.4lb in 1974 and 40.1lb in 1994. Yet over the same time period, the availability of vegetable oil grew massively, from 4.3lb per person in 1924 to 27.6lb in 1994, growth of well over 500%.
The most obvious and startling trend in the data is the steep rise in both total fat availability and vegetable oil availability in the decade leading up to 2010. Total fat availability rose by 22.4lb per person, almost 55%. Vegetable oil availability rose by 24.9lb per person, a rise of over 80%. In 2010, vegetable oil accounted for 87% of all added fat available to Americans.
One might expect such enthusiastic and complete adoption of a public health message — “eat more unsaturated vegetable fats” — to be accompanied by a commensurate increase in coronary health. And indeed, the prevalence rates for total cardiovascular disease fell substantially over this time period, from 343 deaths per 100,000 people in 2000 to 237 deaths per 100,000 in 20095.
But correlation does not imply causation. Was the increase in consumption of polyunsaturated and monounsaturated plant oils, and the decrease in saturated fats from animal sources, responsible for the increase in cardiovascular health?
Regular readers will be familiar with my opinion on the levels of omega-6 polyunsaturated fatty acids in the Western diet. Although the exact percentage differs between the various oils, vegetable fats are overwhelmingly responsible for the extremely high amounts of omega-6 PUFAs most of us consume.
The American Heart Association maintains that this is good news for coronary health. In 2009, they reaffirmed their stance:
A large body of literature suggests that higher intakes of omega-6 (or n-6) polyunsaturated fatty acids (PUFAs) reduce risk for coronary heart disease (CHD). However, for the reasons outlined below, some individuals and groups have recommended substantial reductions in omega-6 PUFA intake. The purpose of this advisory is to review evidence on the relationship between omega-6 PUFAs and the risk of CHD and cardiovascular disease.
[...]
Aggregate data from randomized trials, case-control and cohort studies, and long-term animal feeding experiments indicate that the consumption of at least 5% to 10% of energy from omega-6 PUFAs reduces the risk of CHD relative to lower intakes. The data also suggest that higher intakes appear to be safe and may be even more beneficial (as part of a low–saturated-fat, low-cholesterol diet).
But a large amount of contemporary evidence suggests that increasing omega-6 PUFA intake without adjusting omega-3 intake may in fact increase the risk of cardiovascular disease. For example, a 2010 meta-analysis concluded:
For non-fatal myocardial infarction and CHD death, the pooled risk reduction for mixed n-3/n-6 PUFA diets was 22 % (risk ratio (RR) 0.78; 95 % CI 0.65, 0.93) compared to an increased risk of 13 % for n-6 specific PUFA diets (RR 1.13; 95 % CI 0.84, 1.53). Risk was significantly higher in n-6 specific PUFA diets compared to mixed n-3/n-6 PUFA diets (P = 0.02). RCT that substituted n-6 PUFA for trans fatty acids and saturated fatty acids without simultaneously increasing n-3 PUFA produced an increase in risk of death that approached statistical significance (RR 1.16; 95 % CI 0.95, 1.42). Advice to specifically increase n-6 PUFA intake, based on mixed n-3/n-6 RCT data, is unlikely to provide the intended benefits, and may actually increase the risks of CHD and death. [Edited for clarity, emphasis added.]
And a study published in the British Medical Journal in February found:
Advice to substitute polyunsaturated fats for saturated fats is a key component of worldwide dietary guidelines for coronary heart disease risk reduction. However, clinical benefits of the most abundant polyunsaturated fatty acid, omega 6 linoleic acid, have not been established. In this cohort, substituting dietary linoleic acid in place of saturated fats increased the rates of death from all causes, coronary heart disease, and cardiovascular disease. An updated meta-analysis of linoleic acid intervention trials showed no evidence of cardiovascular benefit. These findings could have important implications for worldwide dietary advice to substitute omega 6 linoleic acid, or polyunsaturated fats in general, for saturated fats. [Emphasis added.]
These studies provide a compelling counterpoint to the American Heart Association’s recommendations.
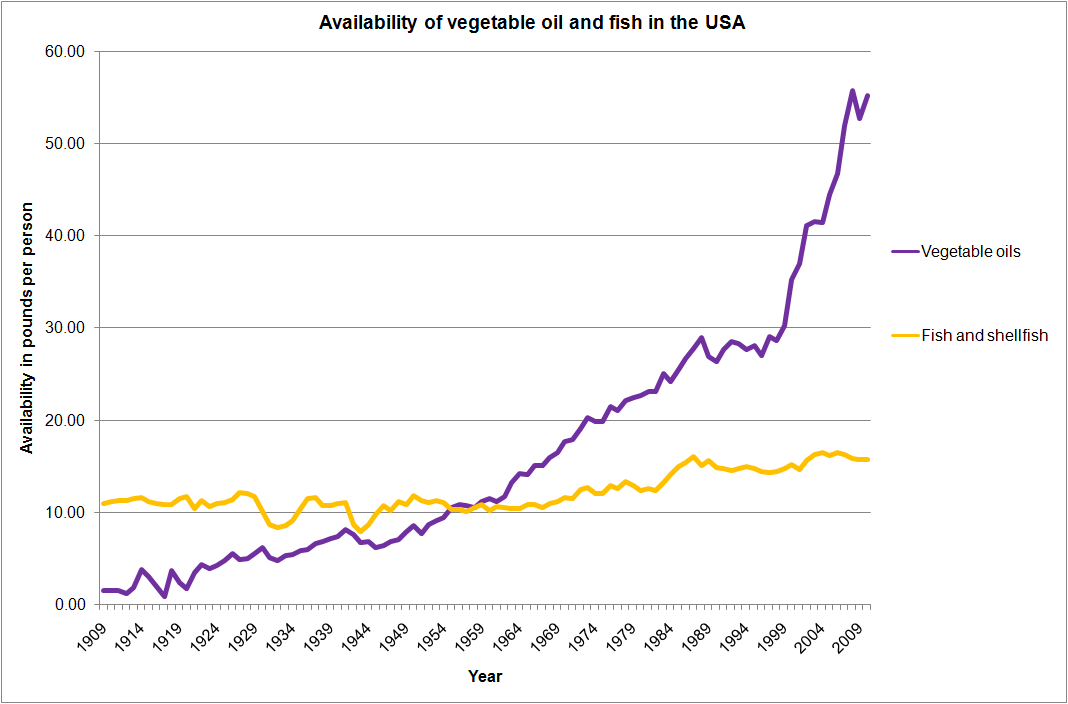
The two charts shown at the beginning of this article are largely the result of the work I’ve been doing with food availability data, reorganizing and republishing data from the USDA ERS in a web-friendly format. The ERS don’t directly measure the availability of omega-3 PUFA, but they do measure the availability of fish, the primary food source of omega-3s in the Western diet. Curious, I decided to graph the availability of vegetable oil against the availability of fish to try to get an idea of how the omega-3:omega-6 ratio has changed over time.
I knew from the start that such a comparison would have only limited use. Only oily fish are a significant source of omega-3, and the ERS doesn’t subdivide their availability data by fish type. Further, even in oily fish, omega-3 PUFAs make up a relatively small portion of the overall weight. A pound of vegetable oil might provide somewhere between 45 grams6 and 270 grams7 of omega-6 fatty acids, but a pound of tuna provides only around 5-10 grams of omega-3. (Please forgive me for abusing unit conversion in such horrid fashion.) In short, charting the availability of vegetable oil against that of fish in an effort to get an idea of trends in omega-3 and omega-6 consumption will massively over-represent the amount of omega-3 available. Just keep that in mind as you look at this chart:
Vegetable oil availability completely dwarfs fish and shellfish availability. The chart depicts a huge imbalance between omega-6 and omega-3 availability even before making any kind of adjustment for the vastly greater amount of omega-6 FAs in vegetable oil than omega-3 FAs in fish. In other words, even if somehow all fish consumption consisted of nothing but eating the fattiest tuna available, it would still pale in comparison to the gargantuan quantities of omega-6 PUFAs being consumed from plant oils.
What this means largely depends on which evidence you find the most compelling. The role of omega-3 fatty acids, and in particular the omega-3:omega-6 ratio, in cardiovascular health is not without its critics, but the same could be said for virtually any proposition in the nutritional sphere.
If you’re convinced by data supporting the importance of the ratio, the fact that fish availability has increased only very modestly over the last century while vegetable oil availability has increased by a factor of 40 is worrying to say the least. While rates of cardiovascular disease have decreased, that statistic alone does not endorse the wisdom of America’s current nutritional trajectory.
Perhaps the most important message is this: when public bodies issue health advice, they’d better be sure they get it right.
The charts in this post use data from the ERS Food availability data system. A portion of the data is available in a web-friendly format here.
- Heart-healthy oil claims reconsidered from CBC news [↩]
- Intake of trans fatty acids and risk of coronary heart disease among women [↩]
- Effect of Dietary trans Fatty Acids on High-Density and Low-Density Lipoprotein Cholesterol Levels in Healthy Subjects [↩]
- The influence of trans fatty acids on health: a report from the Danish Nutrition Council [↩]
- Heart Disease and Stroke Statistics—2013 Update – Chart 2-11 [↩]
- for olive oil [↩]
- for soybean oil [↩]


Death from heart diseases did go down but release from hospitals after heart attacks actually increased three folds between 1980 and 2006. The AHA is actually taking advantage better emergency services to justify damaging food recommendations.
Nice post. I learn something totally new and challenging on sites I stumbleupon every day.
It will always be exciting to read through content
from other writers and practice a little something from other sites.
My brother recommended I may like this blog. He used
to be entirely right. This submit truly made my day.
You can not imagine simply how much time I had spent for this info!
Thank you!
I just like the helpful info you provide on your articles.
I will bookmark your blog and check once more here regularly.
I’m relatively certain I will be informed many new
stuff proper right here! Best of luck for the following!
Hello admin, i’ve been reading your articles for some
time and I really like coming back here. I can see that you probably don’t make money on your website.
I know one interesting method of earning money, I
think you will like it. Search google for: dracko’s tricks