How to eat healthily for £1 per day – version 0.2

In version 0.1, I laid out the aims of this project and put together a proof-of-concept £1-per-day diet that met most of the nutritional goals set by the UK government.

In this post, I’ll be focusing more on a meal plan, introducing a greater variety of foods, and trying to improve intangible factors like culinary enjoyment of the food.

(To avoid repeating myself I won’t go over the project goals, assumptions or rules again, so if you haven’t read version 0.1, it might be worth it to get up to speed.)

Variety

In version 0.1, we ranked foods by calories-per-£1. This was an acceptable first-order approximation of food cost, but we can do better. Calories turned out to be very cheap — white rice provides over 9000 calories per £1 — so it will be helpful to introduce some new metrics that are better attuned to other, more costly to satisfy, nutritional goals. If we want to eat 5 portions of vegetables per day, we don’t much care how many calories those vegetables provide; we can always add cheap calories by eating more rice. It makes more sense to measure the cost of each portion directly.

In version 0.1, the primary source of protein was yellow split peas alone. The primary sources of fruit and vegetables (FaVs) were bananas, carrots, onions, cabbage and tomatoes. These are the two areas in most need of more variety, so we’ll be using two new metrics – price-per-FaVs-serving and price-per-100g-protein. Read more ›

Posted in Blog Posts

How to (actually) eat healthily on £1 per day

Last week, I stumbled across a BBC News article entitled How to eat healthily on £1 a day via a story on hacker news. Healthy eating on a budget is something I’m really interested in, but I was horribly disappointed by the article, because i) it didn’t show you how to eat healthily, and ii) it didn’t show you how to eat on £1 per day.

Cheap food is a false economy

Foods the article advocated eating included:

  • A ham sandwich
  • Jam
  • Bacon
  • Biscuits (!)

Put plainly, these foods are not especially healthy, and some are decidedly unhealthy. (Biscuits, I’m looking at you!)

The diet the article outlines is also woefully deficient in fruits and vegetables. The UK Department of Health and the National Health Service recommend eating 5 portions of fruits and vegetables every day. A portion is defined as 80 grams.

On day 1, the journalist eats 1 apple, 1/4 of a courgette, 1/4 of a red pepper and 50g peas. By my back-of-the-envelope calculations, that’s about 3 portions.

On day 2, he eats 75g mushrooms, a small onion, a banana and “a single leaf” of lettuce with a tomato, for a total of perhaps 4 portions.

On day 5, he eats “four slivers of cucumber”, 50g beans and 25g kale. It’s also possible he eats an apple – the article is unclear. Let’s be generous and assume he does, for a total of 2 portions of fruit and vegetables.

Jam and biscuits are not health foods, and eating a couple of portions of fruit and vegetables a day is not nearly enough. This diet is not healthy. To make matters worse, after consulting a dietitian he concedes he was “well short” on the number of calories he was eating. The diet proposed in the article is a complete failure from a health perspective. Read more ›

Posted in Blog Posts

The opportunity cost of eating candy

sugar 300x225 The opportunity cost of eating candy

Credit: Uwe Hermann

It seems to me there are two different ways of looking at diet.

In the first model, which is the most common, foods are appraised on their strengths and weaknesses. Candy is bad because it’s high in sugar. Vegetables are good because they’re high in fiber. Partially hydrogenated vegetables oils are bad because they’re high in trans fats. Tuna is good because it’s high in omega-3 fatty acids.

Under this model, it’s common to hear foods talked about in absolutes, like “whole grains are a good source of fiber” or “potatoes are a good source of vitamins B, C, E and K”.

But this kind of language has always bothered me. What does a “good source” actually mean? How can we quantify what counts as a good source of vitamin C, as opposed to a mediocre source or a poor source?

The intuitive answer is “based on how much vitamin C the food has”. If it has lots, it’s a good source. If it has a small amount, it’s a poor source.

But how do you measure how much vitamin C a food has? Read more ›

Posted in Blog Posts

What happens when you take public health advice to heart?

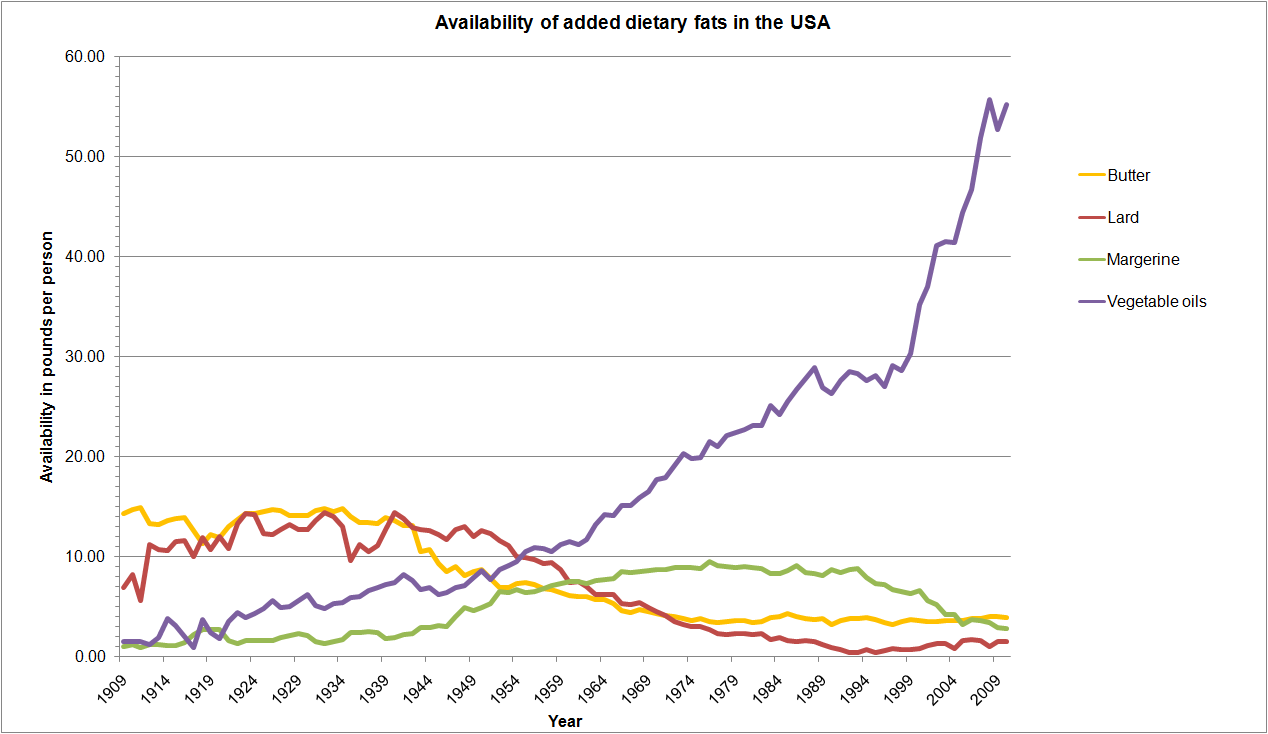
availability added fats What happens when you take public health advice to heart?

In a manner of speaking, the chart above demonstrates the success of public health education. Since the 1960s, public health officials have advised people to lower their consumption of animal fat and increase their consumption of unsaturated fats from vegetable oils.

The graph, which charts the availability of various sources of added dietary fat from 1909 to 2010, shows a precipitous decline for lard and butter from the early 1950s onwards. (Availability isn’t the same thing as consumption, but for long-trend historical data, it’s the closest statistic we have.) Margarine, lauded for decades as heart-healthy, rises steady in popularity in the post-war years before beginning to tail off in the 1990s with the growing realization that trans fats, created by the partial hydrogenation of vegetable oils, render margarine a serious menace to coronary health. Read more ›

Posted in Blog Posts

What we eat: the most consumed foods in America

What are the five most consumed vegetables in America?

I needed an answer to that question a couple of weeks ago for my post about grains, fruits, vegetables and fiber. I thought that finding an answer would be trivial, but it turned out to be rather annoying.

There’s no shortage of unreliable sources purporting to provide this kind of information. But data taken from content farms and question-and-answer sites is junk. In my searching, I also came across a decent number of papers from the USDA and other reputable government agencies, but they were usually only tangentially connected to answering my question.

Eventually, I turned to food availability data from the USDA Economic Research Service. But even then, extracting the information I needed was cumbersome. The data are published in a series of Excel workbooks; that creates much more friction for the reader than publishing on the web. Worse, the data aren’t formatted in such a way as to make it easy to see which foods are the most available. For vegetables, the availability data are presented in a long horizontal alphabetized list that’s difficult to sort without cutting and pasting into a new workbook.

All this was much too much effort for me, so, fueled by a particular kind of indignant laziness, I’ve spent the last couple of weeks rearranging the food availability data into a series of web-friendly tables, sorted by availability.

Regular readers will know I like my nutritional data per-calorie rather than per-pound. Calorie content, not mass, is the primary limit on food consumption for the health-conscious citizen. So, where possible, I’ve also computed food availability information for calories-per-person in addition to the ERS’s pounds-per-person.

So have at it – read, copy, repurpose, remix, do anything you like with the data. I’m looking forward to seeing if people are as interested in this information as I am. (And, after battling against Excel for so many hours, mildly apprehensive that they won’t be.)

There are a few important caveats when using food availability data to estimate food consumption, so please do pay attention to the limits of the data.

Over the next few weeks, I’ll be publishing a series of posts analyzing the patterns and trends I find most interesting. But in the mean time, dive in!

Posted in Blog Posts

Healthy food is cheaper than junk food, except by the only metric that matters

The USDA Economic Research Service published a report in 2012 called Are Healthy Foods Really More Expensive? It Depends on How You Measure the Price.

The aim of the research was to compare the prices of healthy foods with unhealthy foods using a variety of metrics.

For the purposes of the report, “healthy foods” were defined as foods that:

Contain an amount of a food in at least one of the major food groups (vegetables, fruits, grains, dairy, and protein foods) equal to at least half the portion size that the Dietary Guidelines for Americans 2010 uses for measuring the nutrients in that food, and contain only moderate amounts of saturated fats, added sugars, and sodium.

Thus, “healthy foods” encapsulates not only fresh fruits and vegetables but also milk, fruit juice, whole-grains and even products like white bread, which would fall into the “enriched grains” subcategory. The “vegetable” category includes starchy foods like potatoes. Everything that doesn’t come under “healthy foods” counts as unhealthy food, or, in the language of the report, “moderation foods”.

I am naturally suspicious of any study that categorizes white bread or potatoes as healthy foods, but what really grabbed my attention was the report’s editorial musings on the value of the different metrics used to measure price. Read more ›

Posted in Blog Posts

Whole grains are a lousy source of fiber

Eating more dietary fiber can reduce your risk of stroke. That’s the conclusion of a major meta-analysis to be published in the May issue of Stroke.

The authors analyzed 8 large prospective cohort studies. Their results showed a pooled estimate of 7% reduction in relative risk of first-time stroke for each additional 7 grams of fiber added to the diet. (The authors point out that data is sparse for diets containing more than 25 grams of fiber per day, so extrapolation of the protective effect above this amount may be premature.)

However, the study lacked the statistical power to reliably discern the effects of soluble vs. insoluble fiber, or the effects of fiber from different dietary sources.

In short, the only message the authors fully endorse is the paper’s conclusion:

Higher total dietary fiber intake is significantly associated  with lower risk of first stroke. Overall, findings support  dietary recommendations to increase intake of total dietary  fiber. However, a paucity of data on fiber from different foods  precludes conclusions regarding the association between fiber type and stroke.

Encouraging stuff. And truthfully, if that were the end of the story, I probably wouldn’t have been tempted to write about it. What snagged my attention in the first place was an interview with the paper’s co-author, Victoria Burley, published on the U.S. Department of Health and Human Services Healthfinder.gov website, particularly this snippet: Read more ›

Posted in Blog Posts

Why you (almost certainly) shouldn’t take an omega-6 supplement

In November 1978, a six-year-old girl was admitted to hospital with a serious gunshot wound to the chest. Gravely injured, she underwent a long series of operations to repair the damage to her abdomen. More than three meters of her gastrointestinal tract had to be removed. For months she was unable to digest food. To prevent malnutrition, her doctors put her on a regimen of total parenteral nutrition (TPN), a form of liquid sustenance injected directly into the bloodstream.

At that time in America, it was common for TPN to contain chiefly carbohydrate in the form of sugar, a small amount of protein and zero fat. But clinicians had begun to realize that patients fed such a diet would eventually experience essential fatty acid (EFA) deficiency, showing symptoms such as rashes and hair loss.

Doctors in the late 70s had experimented with supplementing TPN with essential fatty acids, replacing a portion of the calories from sugar with calories from a dietary fat called linoleic acid. Linoleic acid is an essential omega-6 fatty acid. It is essential in the sense that without a dietary source of linoleic acid, normal growth and development is impossible. The importance of linoleic acid to cell function had been determined by a large amount of research beginning in the late 1920s. The name omega-6 refers to the molecular structure of the fat, with a carbon double bond in the sixth position counting from the end of the molecule. Read more ›

Posted in Blog Posts

Why do we eat grains? Thermodynamics!

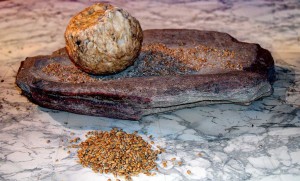
neolithic grain 300x181 Why do we eat grains? Thermodynamics!

A neolithic grindstone for preparing grain.

Around 12,000 years ago, a group of Neolithic humans living in what is now the Middle East conducted a remarkable experiment.

For generations their people had collected the seeds of tall grasses, which they cooked and ate to supplement their diet of foraged fruits, vegetables, and leaves, and hunted game, fish, and seafood.

Some years, due to drought or animal migration, food was harder to find. They adapted by moving to new areas or reorganizing their hunting and foraging parties. But venturing into new ground meant encroaching on the territory of others, and when a rival tribe was unwilling to cooperate the result was often war.

So these early humans tried a new way of dealing with unreliable food supplies. They gathered seeds from the tall grasses and planted them within their own territory. They watched over them, weeded out other plants, and did their best to fend off birds and other pests. The plants survived long enough to produce more seeds. The experiment was a success.

So began the most significant cultural and social upheaval in human history. Read more ›

Posted in Blog Posts

Using a french press for tea

Tea leaves are preserved for more infusions.

Ever make tea in a french press? Try putting the tea leaves on top of the strainer instead of below.

It works great for teas you want to infuse for a limited time (that is, most types of true tea.)

If you put the tea below the strainer (as you would with coffee grounds) you have to pour out all the tea when your infusion time is up. That’s kind of annoying if you’re making a pot of tea for one.

By putting the tea on top of the strainer, you can simply lift the tea leaves out of the water when it’s infused to your liking. You don’t have to pour all the tea out of the french press to avoid over-infusing your tea.

Allow me to illustrate: Read more ›

Posted in Blog Posts